


Monitoring the dissemination of COVID-19-related scientific publications in online media
Research around COVID-19 has experienced broad public interest, with new findings being distributed in various communication platforms. In this blog post we introduce a monitoring tool for exploring the social media reception of scientific publications on the pandemic.
In response to the COVID-19 pandemic, researchers from all over the world and from multidisciplinary backgrounds are working on answers to the challenges raised by the disease. In this regard, the biomedical point of view is also accompanied by broader social, economic and political perspectives. At CWTS, a dedicated research program has recently been initiated, with the aim of engaging colleagues and perspectives from diverse disciplines in the research and discussion of the science-related aspects of the pandemic. The research program has started to produce its first results, including the analysis of funding decisions, peer review, scientometric data sources or the issues related with delineating COVID-19 and coronavirus research, among other questions.
Broadening the study of the online media response to COVID-19-related research
Another dimension that we also consider central at CWTS is how the scientific results related to the pandemic are being disseminated and received across online (social) media platforms. Probably, one of the most visible effects of the COVID-19 pandemic has been the surge of news, social media, and online information about the disease, as well as its political, social and health related effects. It is evident that in the interplay of scientists, policymakers, communicators, and society, the pandemic has posed multiple challenges for science communication. As a consequence, there are also many questions that can be studied from a point of view that incorporates means of dissemination different from scholarly communication via scientific publications. At CWTS, we have started to research the Twitter uptake of the science related to the pandemic, the incorporation of these results in Wikipedia articles, and the response by the academic community in the science communication platform The Conversation.
Monitoring the social media reception of COVID-19-related research
With the many different questions and challenges arising from the study of online communication around the pandemic, it is impossible to approach all of them from just one perspective. In this situation, a flexible tool for monitoring how research around the pandemic is being disseminated and discussed on social media is necessary. We have developed a dashboard that provides exactly that: the CWTS COVID-19 social media dashboard offers an easy-to-use visual and flexible tool to explore the online media reception of scientific publications related to COVID-19. It can be used by anyone - scientists, policymakers, journalists and science communicators, or citizens - interested in the uptake of scientific publications related to COVID-19 across multiple online and social media platforms.
Public Tableau dashboard (updated version with data as of January 20, 2021)
The dashboard offers two main analytical views: trend analysis and scatterplots to explore publications’ social media reception. Filters are implemented to explore the data more flexibly, including different selection of measures, time periods, data source choice, and wildcard match filter to select publications including a specific keyword.
In the trend analysis dashboard, the different dates refer to the post date of each of the altmetric events considered (e.g., news mentions, blogs citations, tweets, etc.). For each specific date, the number of publications and social media events happening on that date are presented in the dashboard. You also have the option to select the social media source to be plotted, as well as the period of monitoring, and the different databases that are considered in the COVID-19 research related database maintained at CWTS.
The explore publications dashboard allows for multiple analytical visualizations, by combining each time two different social media metrics, and allowing the same filtering options as above. It is also possible to identify publications with given title keywords, just by typing them (without any wildcard) in the Filter option of the dashboard and pressing Enter. The aim of this dashboard is to provide an exploratory tool that can help identify publications with different types of online reception (e.g., tweets vs. news), being able to characterize them (i.e. the size of the node) by other indicators such as their number of citations, or whether they are recommended in F1000Prime (indicated by red color).
Data. The dashboard is constructed based on the updated data sources described in Colavizza et al. (2020). Publication data is extracted from the WHO, Dimensions, and CORD19. Social media data is extracted from Altmetric, a company whose mission is to track and analyze the online activity around scholarly research outputs. Twitter data has been re-hydrated by CWTS using the Twitter API. Recommended publications identified via Altmetric can be further explored in F1000Prime. The underlying, aggregated data can be extracted from the dashboard, thus giving the users a possibility for performing their own analysis. The current version contains data updated until 03/6/2020 and stems from more than 123,000 publications related to COVID-19 or Coronavirus. The dashboard covers more than 53,000 publications that have been mentioned at least once by any of the (social media) sources considered (Twitter, blogs, news media, F1000Prime, and Wikipedia). The default visualization set of the dashboard includes more than 26,000 publications from 2020 with social media mentions in this year, although you can modify these parameters.
Methods & measures. The overall methodological approach is documented in a GitHub repository. The metrics calculated include: citations (from Dimensions.ai), tweets and retweets, blog mentions, news media mentions, Wikipedia citations, and whether publications are recommended by experts in F1000Prime. Updates of the dashboard are expected monthly (although variations may occur). The latest updates will be reported in the dashboard.
Use cases
Below, we present two use cases to illustrate the analytical possibilities of the dashboard.
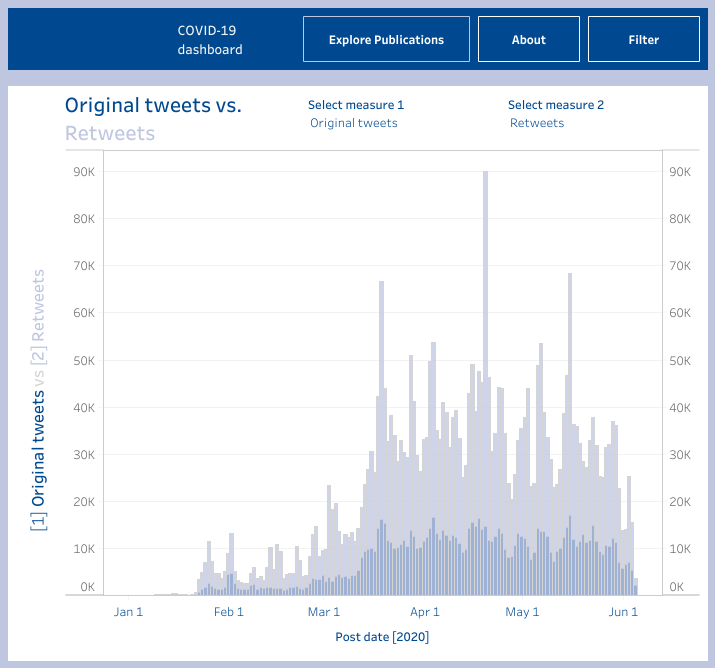
The first one is the temporal analysis of the reception on Twitter (Figure 1 below). This figure captures the temporal evolution of original tweets and retweets around COVID-19 related publications, showing how Twitter engagement has reached a stable level after a rapid increase between mid-February and mid-March.
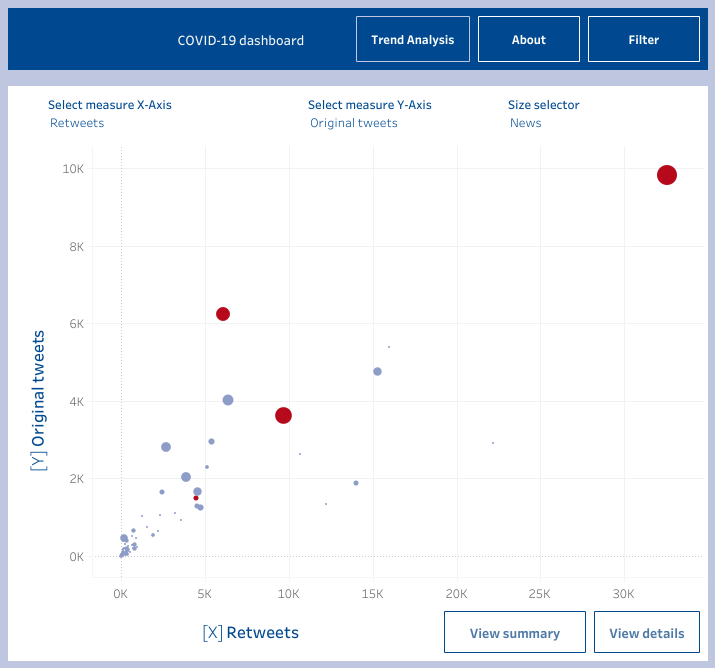
The second use case (see Figure 2) is observed at the publication level (following the option “Explore Publications”). We have selected publications containing the term “hydroxychloroquine” in their titles. It is possible to see how many of these publications have received substantial attention on Twitter, both in terms of original tweets and retweets (as well as in news media, measured by the size of the circles). Publications that have been recommended at least once in F1000Prime during the period selected are highlighted in red. There is a publication on the top right side of the graph with a very high volume of tweeting activity as well as reception in the news. This is a recent publication retracted in the Lancet due to the inability to replicate its results and the serious concerns related to the veracity of the data and analyses conducted. Interestingly, the paper was recommended in F1000 Prime as captured by Altmetric (and colored red in Figure 2). This example illustrates how social media metrics can play an interesting role in identifying potential publication issues. For example, doubts about the paper and its design were raised already on Twitter as early as May 22.
We expect that the broader community can benefit from a
flexible and intuitive tool that periodically informs about the social
media reception of the science produced around the pandemic. Feedback and suggestions for further improvement are more than welcome. We may
incorporate these in updates of the dashboard in the months to come.
1 Comment
The COVID-19 pandemic is now the most dangerous infectious disease on the planet, infecting millions of people. It affects people of all ages and genders, and it is the most easily transmitted human pathogen yet discovered. With the global increase in COVID-19 infection and mortality rates, illness prevention is a top issue. Scientists from around the world are working to develop more sophisticated diagnostic tests, effective vaccinations, and novel therapy regimens based on Covid-19 patient samples in order to put an end to the Coronavirus pandemic.
Add a comment