Why are global health needs unmet by research efforts?
Not all diseases receive equal research attention across the globe. This phenomenon, often referred to as the 10/90 gap in health research, has a long history, rife with contention and debate on its accuracy. New research seeks to uncover various factors perpetuating these inequalities.
Research efforts in health are well known to have unequal distributions: there is much more research on diseases more prevalent in rich countries than in diseases more prevalent in poorer countries. Why is this imbalance so persistent in spite of initiatives to support health research in the global south? In a new working paper, we provide evidence of three drivers of this inequality: the high concentration of research in the global north, the similarity of disease focus between public research and big pharma, and the higher visibility (in terms of citations) of diseases more prevalent in rich countries. Our analysis shows that a systematic underinvestment in research concerns not only diseases such as malaria, mainly affecting developing countries, but also diseases with a major burden in high and upper middle income countries such as depression or stroke.
Comparing disease burden with research efforts
How is science responding to pressing and diverse health needs at the global level? One way to think about this response is to compare the burden caused by a disease with the amount of research conducted on that disease. First, we estimate the burden of a disease in a given country using so-called DALYs (Disability Adjusted Life Years) for 2010. DALYs account for the years of life that a person loses due to death or disability. Second, the amount of research on a given topic can be proxied using publication data (2010-14), as illustrated for instance by the web-based tool for the visualisation of research funding landscapes made available by the newly established Research on Research Institute (RoRI).
Combining these sources, one can contrast the amount of research with the disease burden. To make this comparison, we classified diseases into five categories depending on whether their burden is smaller or larger in High Income Countries (HICs) or in Lower and Middle Income Countries (LMICs). As shown in Table 1, these categories go from Type 1a (diseases more prevalent in HICs, such as pancreas cancer or multiple sclerosis) to Type 1b (equally prevalent), to Type 1c (a bit more prevalent in LMICs) to Type 2 and 3 (much more burden in LMICs, such as malaria or tuberculosis).
Type | Relative disease burden per capita1 | Description | # Diseases | Exemplary cases |
1a | < 0.75 | More burden in HICs | 34 | Colon cancer, breast cancer, Alzheimer’s disease |
1b | 0.75 ≤ x < 1.25 | Equal burden | 28 | Depression, schizophrenia, ischemic heart disease |
1c | 1.25 ≤ x < 3.00 | A bit more burden in LMICs | 26 | Cirrhosis, stroke |
2 | 3.00 ≤ x < 35.0 | More burden in LMICs | 22 | Maternal conditions, HIV |
3 | x ≥ 35.0 | Quasi exclusive of LMICs | 24 | Malaria, diarrhoeal diseases |
Table 1. Classification of diseases according to the relative of burden per capita in High Income Countries (HICs) compared to Low and Middle Income Countries (LMICs)
1 Note: Relative disease burden per capita is calculated as the ratio of disease burden per capita in Low and Middle Income Countries (LMICs) over disease burden per capita in High Income Countries (HICs).
Research efforts systematically increase for diseases with higher burden in the global north
In analysing the proportion of publications in relation to the disease burden in global terms, we find that, in relative terms, there is ten times more research on Type 1a diseases than on Type 3 diseases. In fact, relative research efforts decrease steadily for diseases with less burden in the global north (see Figure 1). Even the diseases with highest burden in middle income countries (Types 1b and 1c) receive two to three-fold less attention than Type 1a diseases.
Surprisingly, the relative efforts for different types of diseases follow the same pattern for public research as for research published and financed by big pharmaceutical companies (orange and brown bars in Figure 1). Pharma R&D is assumed to respond to market demands, which are generally much higher for diseases affecting people in the global north. Since public research is expected to respond to health needs rather than market demands, one could not anticipate a priori this high degree of concordance. This finding supports the view that public and big pharma research are strongly coupled.

Figure 1: Research effort relative to disease burden (% Publications / % DALYs) per disease type, for all research compared to research published or funded by big pharma
The geographic distribution of research efforts is highly uneven
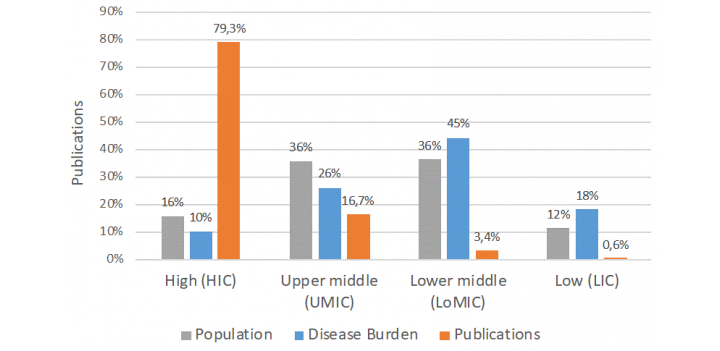
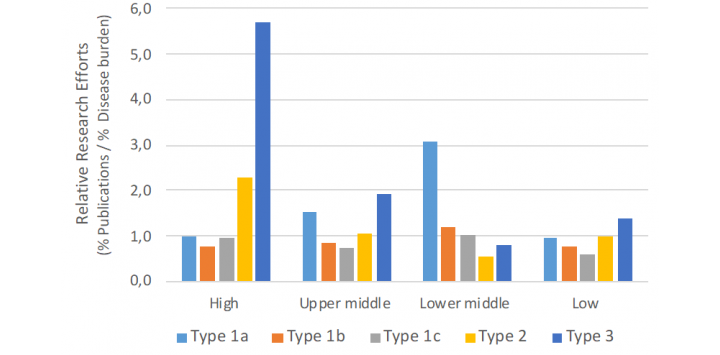
Imbalances in research attention to global health needs can also be partly explained by the high concentration of research in high income countries (79%, see Figure 2) and the fact that research tends to follow national priorities. When we compare research efforts by countries to their own disease burden (see Figure 3), we see that high and upper middle income countries are carrying out more research on diseases prevalent in lower income countries (Type 3) than would be expected according to their own current needs (in Types 1a, 1b and 1c). Nevertheless, this bit of ‘solidarity’ is not enough to compensate for the tiny amount of health research (4%) carried out in lower and lower middle countries in comparison to their disease burden (64%).

Figure 2: Distribution of population (2010), disease burden (proxied in 2010 DALYs), and research efforts (as 2010-2014 publications) across country income levels

Figure 3: Research effort relative to disease burden (% Publications / % DALYs) per disease type and country income level
The influence of system’s incentives
It also worth noticing that in upper middle countries there is a relative 50% over-investment in Type 1a diseases as well as a relative under-investment in research for the diseases that affect them the most, i.e. Type 1b and Type 1c diseases, including for example depression and stroke (see Figure 3). This observation suggests that in upper middle income countries there might exist incentives, in terms of funding or academic rewards, for researchers to publish on Type 1a diseases.
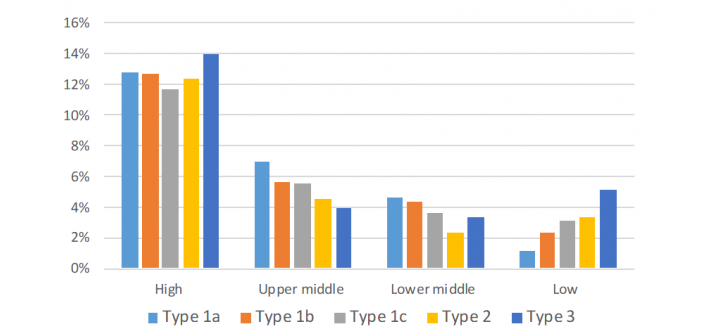
We checked incentives, first, in terms of publication in prestigious journals (in top quartile impact), but did not find a bias. However, as shown in Figure 4, we observed that in upper and lower middle income countries publications have a decreasing citation impact as they move from Type 1a to Type 1c to Type 3. This pattern deserves further analysis, as it may relate to publication incentives: it might be related to the influence on agenda setting of scientific communities based in the global north, or to national evaluation systems reliant on international bibliometric criteria.

Figure 4: Citation impact by disease type by country income level (without international collaboration)
Rethinking priority setting in health research
In summary, the findings of this analysis show that there is relative underinvestment not only for disease most prevalent in lower income countries (that is for ‘neglected’ diseases) but also in high and upper middle countries for diseases such as stroke and depression, which have a similar burden across country income levels.
To correct these pervasive imbalances observed, it is necessary to make investments (or lack thereof) in health R&D more visible, as done for example by the Observatory of Global Health R&D. Yet it is also necessary to more resolutely and strategically re-orient research towards public health outcomes.


0 Comments
Add a comment