


VOSviewer goes online! (Part 1)
Today, the new VOSviewer Online software was released by CWTS colleagues Nees Jan van Eck and Ludo Waltman. In this post, they discuss the possibilities offered by the software.
The value of bibliometric visualizations
Bibliometric visualizations are often presented as powerful tools for identifying the key patterns in large bibliometric data sets. However, not everyone is convinced of their value. Some skeptics suggest that these visualizations are “just nice to look at but not useful or helpful”.
Based on almost 15 years of experience in working with bibliometric visualizations, we have seen many examples of the successful use of these visualizations, but we have seen equally many examples of poor ways of using bibliometric visualizations, often leading to questionable conclusions.
In our experience, a carefully designed bibliometric visualization may offer a wealth of valuable information. However, to access this information, being able to interactively explore the visualization is quite essential. A static visualization without any possibility for interaction has much less value, and may be more likely to be misinterpreted.
From static to interactive visualizations
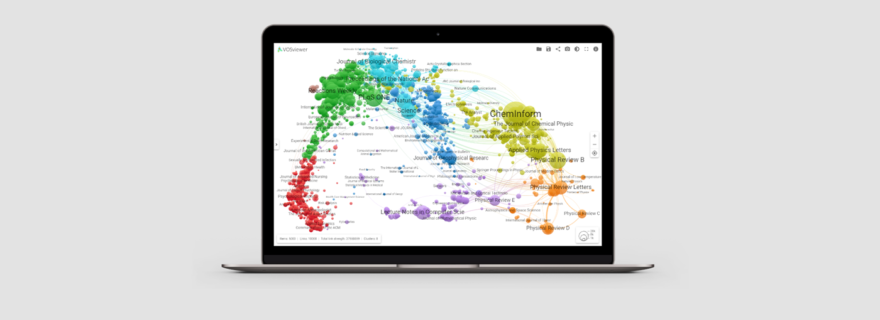
Our VOSviewer software enables visualizations of bibliometric networks to be explored interactively. Nevertheless, VOSviewer visualizations often end up as static images in blog posts, research articles, policy reports, and PowerPoint presentations. In this way the visualizations lose a lot of their value, and in the end they may indeed be “just nice to look at but not useful or helpful”.
To address this problem, we have developed VOSviewer Online, a web-based version of VOSviewer released today. Using VOSviewer Online, visualizations of bibliometric networks can be explored interactively in a web browser. This makes it much easier to share interactive visualizations, and it reduces the need to show static images.
VOSviewer Online can also be used to embed interactive visualizations in a web page. As an example, below we use VOSviewer Online to present an interactive visualization of a co-authorship network of authors of articles published in Quantitative Science Studies and Scientometrics in 2020 and 2021. The network was constructed based on Dimensions data.
VOSviewer and VOSviewer Online
VOSviewer Online can be opened at https://app.vosviewer.com. The tool aims to replicate as much as possible the user experience of the regular stand-alone VOSviewer software. Visualizations are presented in the same way in the two versions of VOSviewer. The user interface is also similar, although we have made some simplifications in VOSviewer Online, hopefully making the software even more intuitive to use.
Importantly, unlike the stand-alone VOSviewer software, VOSviewer Online currently does not provide any built-in functionality for constructing bibliometric networks based on data from bibliographic data sources such as Web of Science, Scopus, Dimensions, Crossref, and others. The stand-alone software still needs to be used for this. VOSviewer Online can instead be used to make interactive visualizations of bibliometric networks available online and to easily share these visualizations.
In part 2 of this blog post, to be published soon, we will discuss in more detail how the two versions of VOSviewer can be used together.
Embedding interactive visualizations in online platforms
An exciting feature of VOSviewer Online is the possibility to embed interactive visualizations in online platforms. The above visualization of a co-authorship network offers an example of this feature. The embedding functionality of VOSviewer Online has already been tested in other blog posts, like this one, and it has been used in news articles in Nature Index, for instance this one.
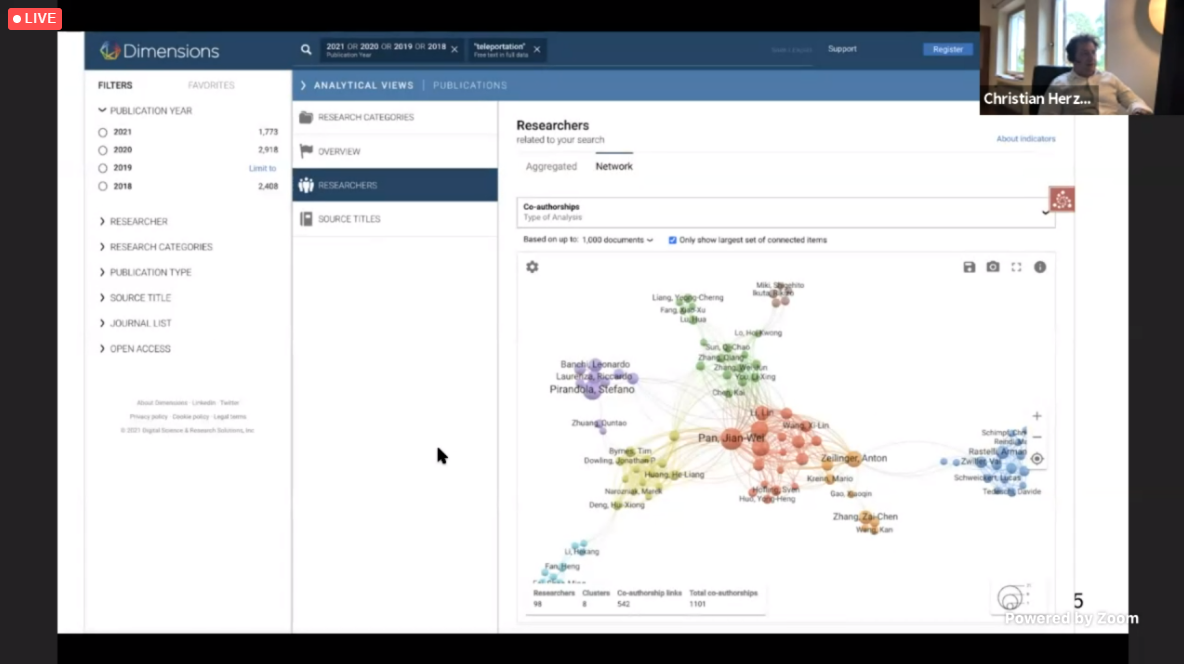
In addition, in the OPERA project in Denmark, interactive VOSviewer visualizations have been embedded in the VIVO system. As announced last Monday at the ISSI 2021 conference, we are also working together with Digital Science to embed VOSviewer visualizations in their Dimensions platform. Likewise, VOSviewer visualizations are also going to be embedded in the AI Research Navigator platform created by Zeta Alpha.
VOSviewer Online can be freely integrated in other platforms as well. Although you don’t need our help for this, we are happy to discuss the possibilities.
Try it yourself
Go to https://app.vosviewer.com to try out VOSviewer Online. Below we present a short video in which one of us (NJvE) explains how to get started. More detailed information about VOSviewer Online is available in VOSviewer Online Docs.
VOSviewer Online is open source. It has been developed in JavaScript. We welcome contributions to the further development of the software. Don’t hesitate to get in touch!
0 Comments
Add a comment