


New interactive website to visualize Big Pharma’s publication landscape
This blog post presents and describes a newly created interactive website on the publication activity of some of the most important pharmaceutical companies worldwide.
How does the research profile of pharma companies look like? What diseases are these companies investigating? What are their main research partners? Where are their laboratories and collaborators located? These are relevant questions for those interested on R&D dynamics in the pharmaceutical sector. However, this type of information is often not publicly available and, when it is available, it is often fragmented. We have developed an interactive website, which aims to provide information around these issues, as reflected in scientific publications produced by pharmaceutical companies.
Interactive visualisations: publication trends and beyond
This Big pharma website offers various visual analyses to browse different aspects of Big pharma’s R&D activity.
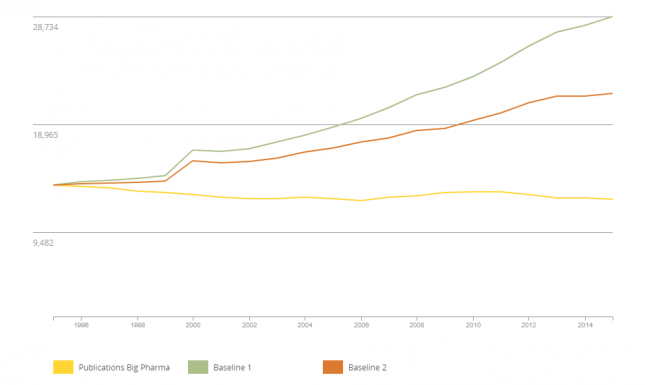
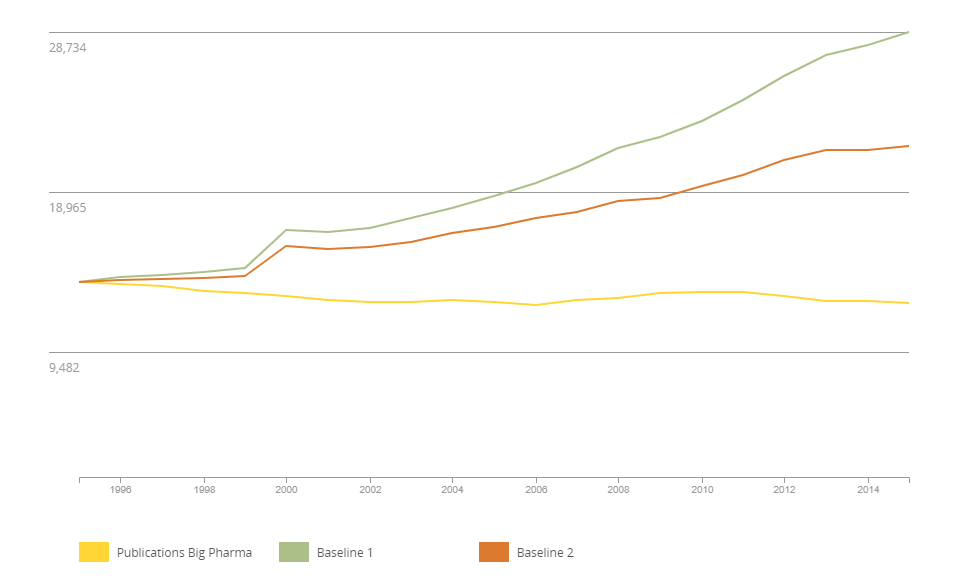
Scientific publication trends can be explored for Big pharma, considering the 23 companies at the same time, or for specific pharma companies individually.
The overall trends for Big pharma are provided together with two relevant benchmarks: Baseline 1 includes all publications worldwide, and Baseline 2 includes the publications produced by key developed countries (United States, United Kingdom, France and Germany).
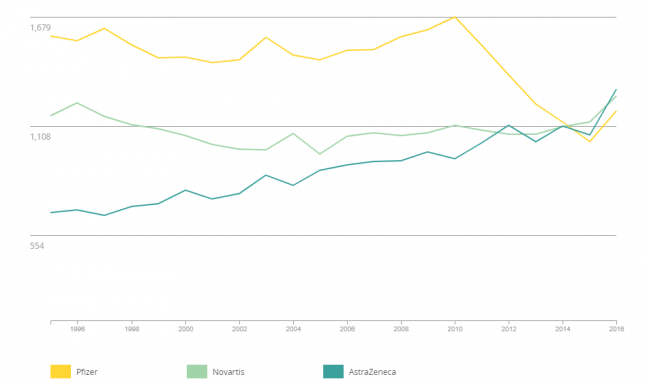
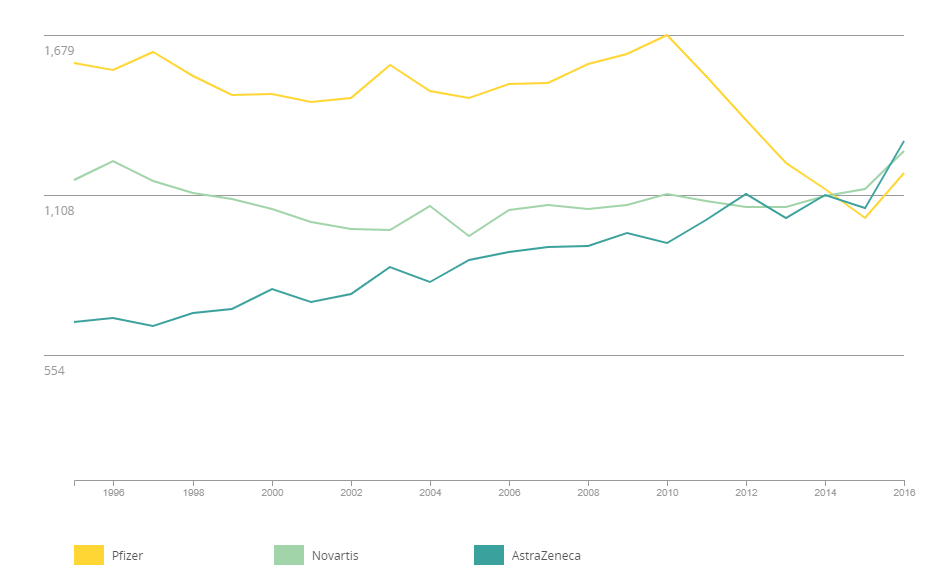
When analyzing publication trends for specific companies, the website allows for the visualization of up to ten different companies. By selecting a specific company in a combo box, the corresponding series will appear in the chart, representing the number of publications of that particular company over time. By clicking in a specific line, the clicked series will disappear, so that the chart will only show the companies of interest.
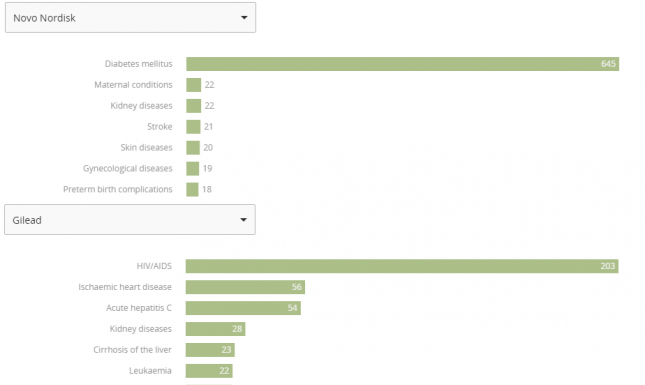
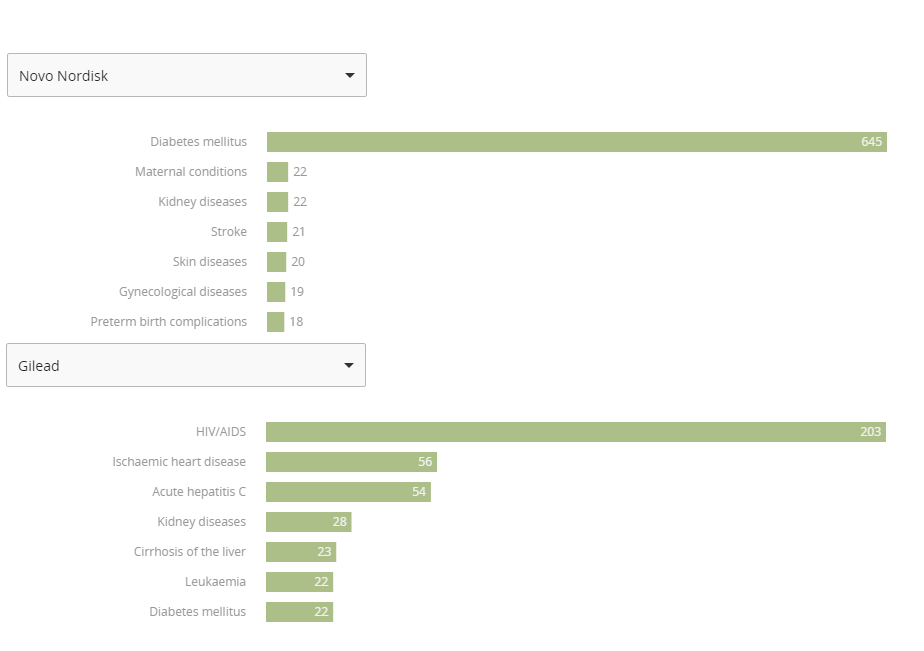
The website also provides a breakdown of scientific publications by disease, allowing the visualization of the therapeutic areas in which companies are focused. The figure below shows the main diseases in the portfolio of two companies, Novo Nordisk and Gilead Sciences. While Novo Nordisk focuses primarily on diabetes, the portfolio of Gilead Sciences appears to be slightly more balanced, with a marked emphasis on HIV/AIDS, but also covering other diseases, such as Ischaemic heart diseases and Hepatitis C.
In this blog post we have highlighted some features of the new tool. Additional analyses, including the evolution of Big pharma’s clinical versus non-clinical research, the country of location of both Big pharma companies as well as their research partners, or the list of companies with the highest number of publications devoted to specific selected diseases can be found in the CWTS’ Big Pharma website.
Pharma companies included in the website
The interactive website includes 23 of the largest pharmaceutical companies worldwide, which are among the main private investors in R&D. In 2017/18, this small group of companies invested almost €100bn in R&D. This amount represents roughly 70% of the total R&D investment by the almost 400 companies in the 2018 EU Industrial R&D Investment Scoreboard integrating the pharma/biotech sector.
Underlying data and sources
Publications were obtained from the CWTS in-house version of the Web of Science (WoS) for the period 1995-2016. The assignment of publications to companies was done considering its complete corporate structure (structure as of 2017, recent mergers are not yet incorporated). By doing so, we considered not only those publications produced by the parent companies, but also those produced by any of their subsidiaries. The corporate structures were identified combining information of merger and acquisitions from various sources, including Bureau van Dijk’s Orbis and several websites.
We have considered a number of disease groups and specific diseases within these groups, in order to get some insights on the therapeutic areas of activity for these companies. We selected diseases and disease groups considered by the World Health Organisation (WHO) in the global burden of disease estimates 2000-2015 (WHO, 2017). The WHO lists diseases accompanied by the corresponding codes of the International Classification of Diseases (ICD-10). We then identified the MeSH terms that best correspond to each of these ICD-10 codes, so that for each specific disease we were able to find the relevant scientific publications through MEDLINE.
Limitations and next steps
While acknowledging that many R&D developments in the private sector cannot be captured through scientific publications, we believe the analysis of this type of information provides some relevant insights on the research undertaken by Big pharma, on their research focus and on their research partners. For a more extensive description of the limitations associated to the use of scientific publications as a proxy of R&D developments in the pharmaceutical industry, see Section 2 in Ràfols et al. (2014).
This sector-specific website is a first step for CWTS in offering information on private R&D developments. In the coming months we will offer new insights on private R&D, by covering companies from different sectors.
0 Comments
Add a comment