


Comparing bibliographic data sources: Q&A
Last week CWTS researchers Martijn Visser, Nees Jan van Eck, and Ludo Waltman published the paper 'Large-scale comparison of bibliographic data sources: Scopus, Web of Science, Dimensions, Crossref, and Microsoft Academic'. In this post, the authors answer ten questions about their work.
Your paper is based on a huge amount of data. How did you manage to get access to so much data?
In the internal database system of CWTS, we have access to the raw data of Scopus, Web of Science, Dimensions, Crossref, and Microsoft Academic. CWTS is probably the only center in the world that has access to all this data, so we are in a unique position to compare the different data sources. Getting access to data from Crossref and Microsoft Academic is easy, since their data is openly available. Anyone can get access to their data. In the case of Scopus and Dimensions, CWTS is in the fortunate situation to receive their raw data for free for research purposes. (Note that Scopus and Dimensions both offer possibilities to scientometric researchers to get free access to their data. See here for Scopus and here for Dimensions.) Web of Science is the only data source for which we pay. CWTS has a paid license that enables us to use Web of Science data in our research.
Why don't you have access to the full Web of Science database?
Web of Science comprises a number of different citation indices. The Web of Science license of CWTS covers the Science Citation Index Expanded, the Social Sciences Citation Index, the Arts & Humanities Citation Index, and the Conference Proceedings Citation Index. It doesn’t cover other citation indices, such as the Emerging Sources Citation Index and the Book Citation Index. To get access to these citation indices, CWTS would have to pay more to Clarivate Analytics, the producer of Web of Science. For future comparative analyses of bibliographic data sources, we hope that Clarivate is willing to grant us free access to the full Web of Science database.
In addition to scientific documents, Dimensions also covers grants, data sets, clinical trials, patents, and policy documents. Why didn’t you include this content in your analysis?
The focus of our analysis is on scientific documents. While we recognize the value of other types of content, this content falls outside the scope of our analysis.
Why didn’t you include Google Scholar, OpenCitations, and the Lens in your analysis?
Google Scholar was not be included because data at the scale required for our analysis is impossible to obtain from Google Scholar. We refer to recent work by Alberto Martín-Martín and colleagues for a comparison of Google Scholar with other data sources. OpenCitations currently obtains most of its data from Crossref. For the Lens, our understanding is that most of the data is obtained from Microsoft Academic. Since Crossref and Microsoft Academic are included in our analysis, the added value of including OpenCitations and the Lens seems limited. However, this is likely to change in the future, when OpenCitations and the Lens become more independent data sources. In future analyses, OpenCitations, the Lens, and others, such as the OpenAIRE Research Graph, definitely deserve close attention.
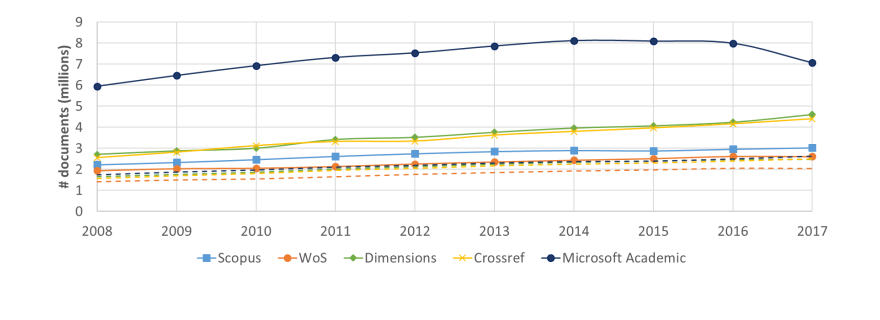
In your paper, you analyze documents published in the period 2008-2017. Why didn't you include more recent documents in your analysis?
Processing all data required for our analysis was a huge effort that took a lot of time. The first steps of the analysis were taken in 2018. This explains why documents from the most recent years are not included.
In your paper, you acknowledge feedback from the various data providers. How much influence did they have on your work?
We invited all data providers to offer feedback on an earlier draft of our paper. This is a standard policy of CWTS for studies in which we analyze and compare scientometric data sources. By inviting data providers to give feedback, we offer them the opportunity to clarify misunderstandings and misinterpretations and we improve the quality of our work. Our paper has benefited significantly from the feedback received from data providers. The interpretation of our findings has become more nuanced, and a number of ambiguities have been resolved. Of course we make sure that data providers don’t influence our work in problematic ways. Of the comments made by data providers, we use the ones that we agree with to improve our paper. We disregard comments that we do not agree with.
You report a number of competing interests in your paper. Are you sufficiently independent?
As reported in our paper, CWTS has commercial relationships with a number of data providers. However, we believe this has had no influence on our paper. We have been able to work in a completely independent way.
CWTS supports the Initiative for Open Citations (I4OC). What do we learn from your paper about the successfulness of this initiative?
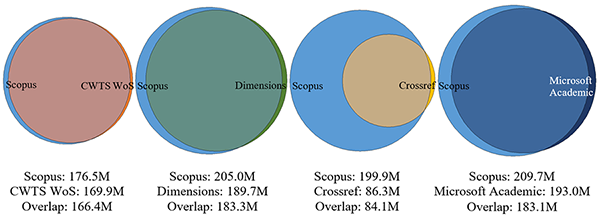
CWTS indeed supports I4OC, an initiative that aims to convince publishers to make the reference lists of articles in their journals openly available in Crossref. The figure shown below, taken from our paper, shows that I4OC has only partly been successful. While Web of Science, Dimensions, and Microsoft Academic have a large overlap with Scopus in terms of citation links, Crossref can be used to obtain only 42% of the citation links in Scopus (for citing and cited documents that are indexed both in Scopus and in Crossref). This is partly due to publishers that do not deposit reference lists in Crossref. It is also partly caused by publishers such as ACS, Elsevier, and IEEE that do deposit reference lists in Crossref but that choose not to make these reference lists openly available.
The main focus of the comparative analysis presented in your paper is on the number of documents covered by the different bibliographic data sources. Is this the right way of comparing data sources?
In our paper, we focus on the coverage of bibliographic data sources and the quality of citation links. Coverage is an important aspect in a comparison of bibliographic data sources. However, as we acknowledge in our paper, there are many other important aspects as well, such as the completeness and accuracy of the data, the speed of updating, the way in which the data is made available (e.g., web interfaces, APIs, data dumps), and the conditions under which the data can be used (e.g., paid or free, with or without restrictions on reuse). Some of these aspects were discussed in a recent special issue of Quantitative Science Studies.
Based on your work, which bibliographic data source do you recommend to use?
It is not possible to provide a general recommendation. Each data source has pros and cons. Which data source can best be used needs to be decided on a case-by-case basis. Comprehensiveness and selectivity often play a key role in such a decision. On the one hand, we like the focus of Dimensions and Microsoft Academic on comprehensiveness. However, sometimes there is a need to be selective, and therefore we believe there is value in filters such as those provided by Scopus and Web of Science. A key question for any data source is how a comprehensive coverage of the scientific literature can be combined with a flexible set of filters that enable users to make selections of the literature.
0 Comments
Add a comment